Precision fertilization by UAV for rice at tillering stage in cold region based on hyperspectral remote sensing prescription map
Cold region rice is a general term for cold region rice, which is mainly distributed in northeast China. Because of the great changes in climate and environment, the planting patterns and field management of rice in the cold region are different from those in the south. In northern China, the temperature and soil temperature are low in early spring, and the nutrient release is slow. Therefore, topdressing outside the root is needed to ensure the yield and quality of rice in the key growth period. Topdressing at tillering stage is the key part of field management of rice in cold areas, and also the first peak of fertilizer demand in the whole growth of rice. Topdressing effect will directly affect the number of tillers and the growth of rice in the middle and late stages. Excessive topdressing at tillering stage could easily cause the increase of ineffective tiller rate, leaf overhanging and overlapping shading, and increase the risk of lodging and disease. At the same time, high nitrogen content in leaves will also hinder the transfer from nitrogen metabolism to carbon metabolism, which may prolong the vegetative growth period and delay the panicle stage.
At present, the topdressing decision of rice UAV topdressing operation mainly relies on the experience of field managers, and lacks effective topdressing decision basis. With the rapid development of UAV low altitude remote sensing technology, researchers at home and abroad have carried out corresponding research on UAV remote sensing diagnosis of rice nitrogen nutrition. This research will rice tillering stage drones diagnosis and agricultural fertilizer quantity remote sensing precision work, the combination of using unmanned aerial vehicle hyperspectral technology to establish the rice tillering stage quantity of fertilizer prescription figure, on the basis of the combination of agricultural drone operation parameters, treat fertilizer plots for grid division, determine each grid fertilizer spraying quantity, and the precise fertilizer with the agricultural unmanned aerial vehicle , In order to provide data and model basis for UAV precision variable topdressing at tillering stage of rice in cold region.
1. Materials and Methods
1.1 Overview of the study area
The experimental site is located in Liu tiao he Village (42°01 '17.16" N latitude, 123°38' 14.57" E longitude) of Shen Bei New District, Shenyang City, Liaoning Province, which is a typical rice growing area in cold region. The experimental variety is "Jing you 653", which is widely cultivated in Liaoning
Province. The experiment was conducted from May to November 2019. Soil samples were collected before rice transplanting and after rice harvest. Remote sensing topdressing diagnosis of UAV and variable fertilization of agricultural UAV were carried out at re-green stage and tillering stage. After the rice is mature, the yield of the plot is measured.
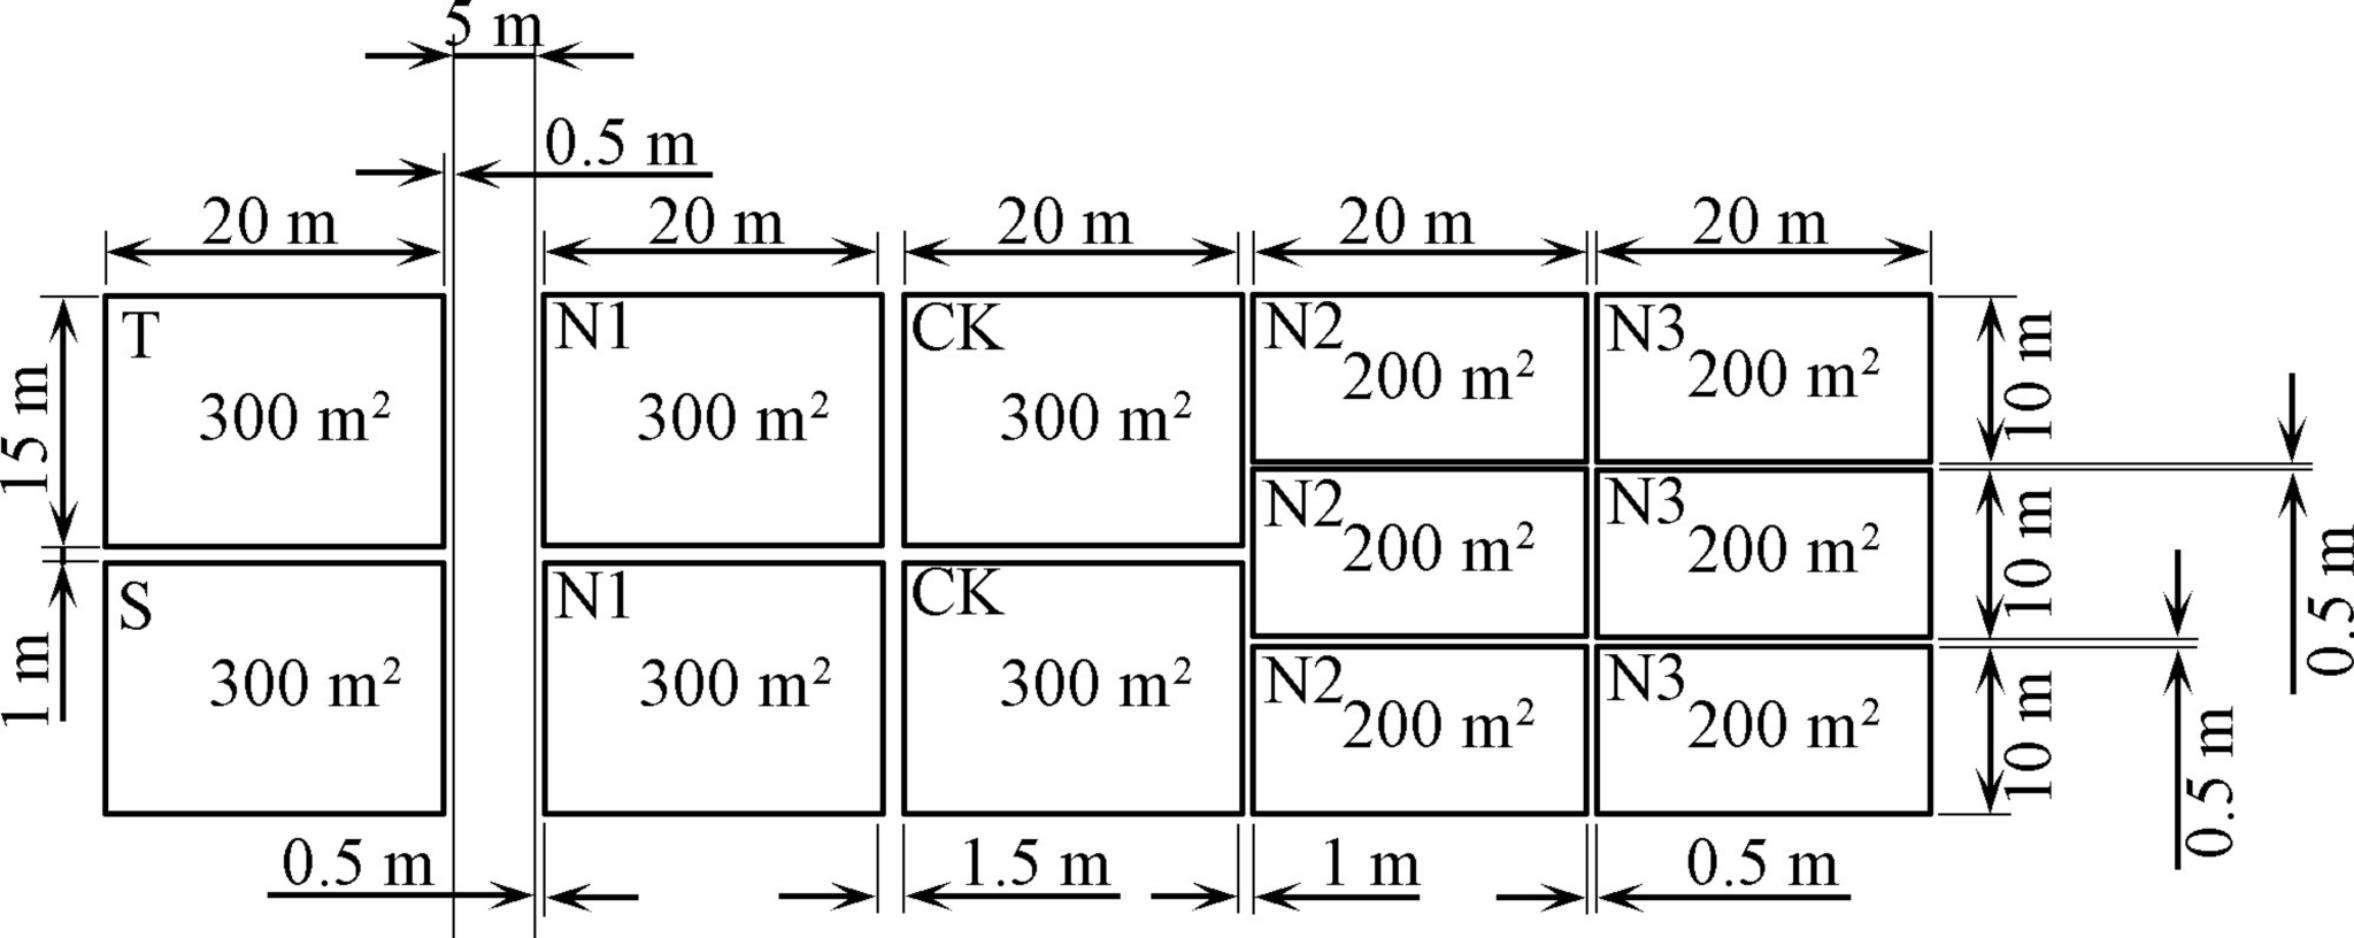
Note: CK is the control group; the application rate of N1 is 45 kg·hm-2, that of N2 is 22.5 kg·hm-2, and that of N3 is 67.5 kg·hm-2; T is the traditional artificial fertilization management area; S is the management area recommended by agronomic experts.
1.2 Data Acquisition
1.2.1 Acquisition of UAV hyperspectral remote sensing image
The UAVS hyperspectral platform adopts M600 PRO six-rotor UAVs from Shenzhen DJI Innovation Company, and the hyperspectral imager adopts GaiaSky-mini built-in thrust-sweep airborne hyperspectral imaging system from Jiangsu Shuang li He Pu Technology Co. Ltd. The hyperspectral band range is 400 ~ 1 000 nm, and the resolution is 3.5 nm. The number of effective bands was 170, the acquisition time of a single image was 15 s, the frame rate was 162 frames /s, and the flying altitude of the UAV was 100 m. A total of 40 UAV hyperspectral remote sensing images of rice canopy were acquired.
This research will choose at 08:00 hyperspectral data acquisition time - 08:30 between, at the same time in order to reduce the Angle of the sun changes on hyperspectral image acquisition measurement error caused by the unmanned aerial vehicle hyperspectral images in the process of getting every 5 min to calibrate the one whiteboard (reflectivity > 99%) and instrument dark background noise spectrum data collection, it used to calculate the reflectance of hyperspectral images. At the same time, a 1.5m × 1.5m diffuse reflector with 60% reflectance was placed in the hyperspectral acquisition area of each scene for later reflection data correction.
The acquired UAV hyperspectral remote sensing images were preprocessed with the Specview software attached to the airborne hyperspectral limager, including lens, homogeneity and reflectance, and the hyperspectral reflectance images of the test area used for inversion modeling were finally obtained.
2 Results and analysis
2.1 Data Analysis
As pure as the result of the yuan after using MNF transform to extract the input, set the number of iterations for 10000 times, because of the rice paddy water covered in tillering period, paddy mainland content mainly consists of rice, water, soil mixture, the rest of the interference features of very few, so this research mainly aims at the two side yuan high spectral features are extracted, The extraction results are shown in Figure 1. According to the end member spectra of ground objects, the characteristics of the red hyperspectral reflectance curve are neither the reflectance curves of pure soil nor pure water, which is because the sunlight shining on the back of the water layer will be reflected by the water layer, and the other part is transparent.
After passing through the water layer and reaching the soil below, the reflection occurs again, and finally forms the mixed spectrum of the two. Due to the actual demand of tillering stage cultivation and management of paddy field, the soil will be completely covered by water layer, and there will be no simple soil or water surface features, so the mixed state of water and soil is set as a kind of surface features in this study.
On the basis of extracting the hyperspectral reflectance curve of the end member of the rice field, the inversion method of projected abundance in the forward subspace was used to extract the hyperspectral information of rice from the UAV hyperspectral image, and the results are shown in Figure 2.

Fig.1 Results of hyperspectral extraction of surface terminal elements
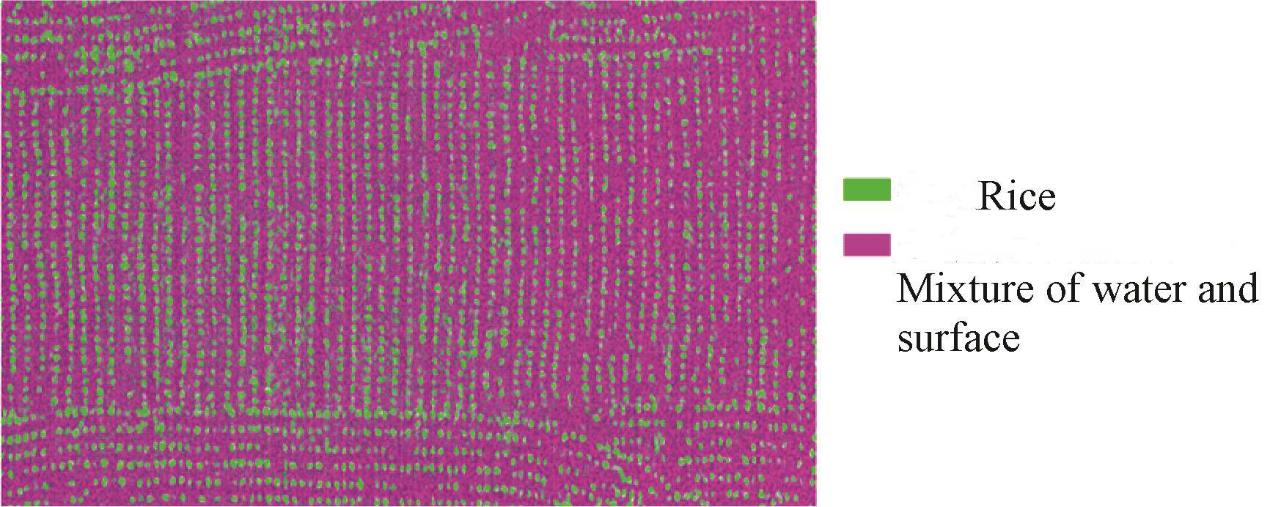
Fig.2 Hyperspectral image unmixing results of UAV
2.2 PSO-ELM inversion results of nitrogen content in rice
Five extracted rice hyperspectral characteristic parameters were input into ELM and PSO-ELM models, respectively, to establish nitrogen content inversion models, as shown in Figure 3.
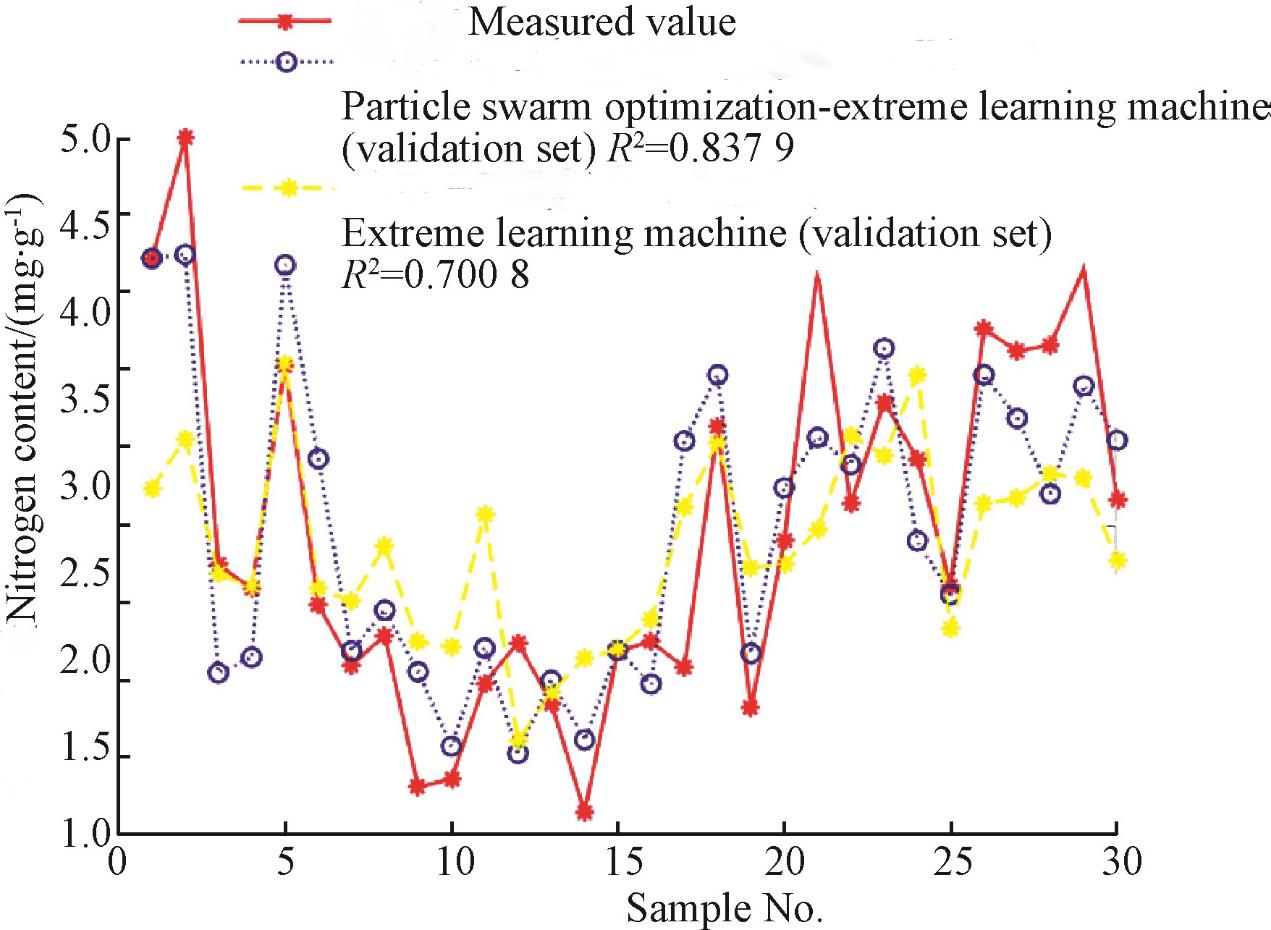
Fig.3 Inversion results of nitrogen content in rice
2.3 Prescription chart generation of UAV topdressing amount at rice tillering stage
The UAV topdressing operation needs to consider the flying speed and spraying amplitude of agricultural UAV, and the response time of liquid pump. Since the UAV hyperspectral remote sensing image is a continuous reflectance information in two-dimensional space, each pixel can invert a topdressing amount. In the actual operation process, agricultural UAVs cannot spray topdressing for every pixel, and the inversion results of hyperspectral remote sensing images need to be raster segmtioned. The variable topdressing prescription chart of agricultural UAV was constructed by combining differential GPS information (FIG. 4).
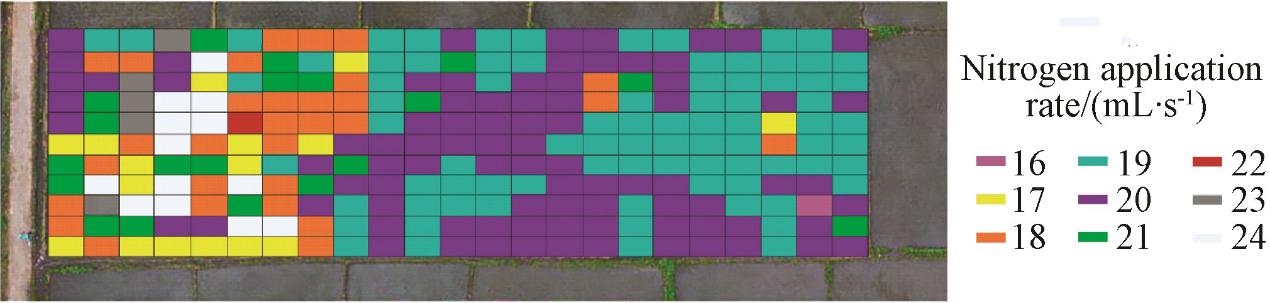
Fig.4 Prescription chart of topdressing amount for agricultural UAV
2.4 Spraying effect of agricultural UAV
Using the droplet test card, 20 droplet sampling points were arranged in four plots of CK, N1, N2 and N3 according to the five-point sampling method. One droplet sampling point in N3 plot was affected by the rotor wind field of the UAV, and the droplet sampling card fell. Therefore, a total of 19 effective droplet sampling points were collected to evaluate the effect of precise topdressing application of agricultural UAV. iDASLite software was used to analyze the data of the droplet test card, and the results are shown in Figure 5.
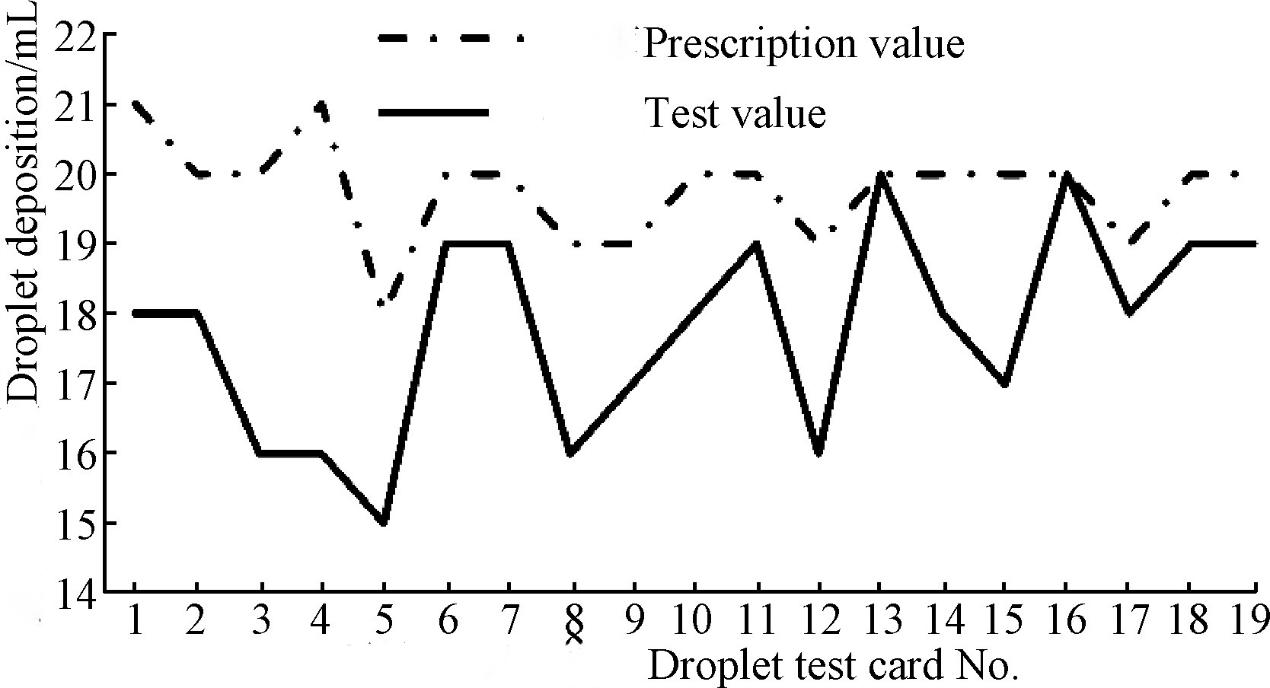
Fig.5 Droplet deposition effects
2.5 Rice yield analysis
Except topdressing management at tillering stage was different in the experimental plots in this study was consistent. After the experiment, rice yield was measured with different management methods, and the yield of each test plot was shown in Table 1.
Table 1 Rice yield of different fertilization methods
|
Fertilization management mode
|
Treatment of base
fertilizer
|
Yield/
(kg·(667 m2)-1)
|
|
No fertilization was conducted during the
whole growth period
|
-
|
443
|
|
Traditional way
|
T
|
503
|
|
Standard farmland management way
|
S
|
504
|
|
Variable topdressing management of UAV
|
CK
|
500
|
|
N1
|
502
|
|
N2
|
505
|
|
N3
|
503
|
According to the yield results, the final yield of UAV variable topdressing was basically the same as that of traditional topdressing management. Compared with the total fertilizer applied in the same plot in previous years, the amount of pure nitrogen in fertilizer was reduced by 27.34%.
2.6 Analysis of soil nitrogen content after harvest
One week after rice harvest, soil samples were collected from the experimental plots and analyzed for nitrogen content (Table 2). As can be seen from Table 2, the available nitrogen in the plots with low nitrogen treatment as base fertilizer increased by 0.004 g/kg after harvest compared with before transplanting, which was determined by the amount of topdressing was underestimated in the decision-making process.
Rice needs to convert total nitrogen into available nitrogen that can be absorbed to supplement a part of nitrogen source, resulting in an increase in the content of available nitrogen in the soil. The difference in the content of available nitrogen in the rest of the base fertilizer treatment plots was not significant. Comprehensive analysis shows that UAV variable topdressing plays an important role in the growth of rice. Under the condition of reducing the amount of nitrogen fertilizer, the overall amount of nitrogen fertilizer can effectively ensure the growth of rice.
Table 2 Soil nitrogen content
|
Treatments
|
Total nitrogen content/(g·kg-1)
|
Available nitrogen
content/(g·kg-1)
|
|
Before
transplanting
|
After
harvest
|
Before
transplanting
|
After
harvest
|
|
CK
|
0.154
|
0.158
|
0.104
|
0.105
|
|
N1
|
0.162
|
0.156
|
0.111
|
0.113
|
|
N2
|
0.159
|
0.152
|
0.117
|
0.121
|
|
N3
|
0.158
|
0.158
|
0.127
|
0.127
|
3 conclusion
Based on rice tillering stage of agricultural precision fertilizer as the research object, using unmanned aerial vehicle imaging hyperspectral remote sensing image of nitrogen concentration inversion model is established through the PSO -ELM, comprehensive consideration of agricultural related operation parameters, combined with the experts recommend fertilization build according to standard field, build the precision fertilizer model, finally using unmanned aerial vehicle precision fertilizer in agriculture.

 13910278534
 010-56370168