APPLICATION
The experiment was conducted in 2019 at the Tianlong experimental base in Pingba District, Guiyang City, Guizhou Province, with different plots of tobacco selected and the lower part of the tobacco leaves taken for the experiment. Ten replicates were taken and each sample was processed as follows: samples were taken from the roasting room, numbered, hyperspectral data were collected and taken back to the laboratory for drying and crushing, and the chlorophyll content was determined spectrophotometrically.
The chlorophyll content was determined spectrophotometrically. Tobacco leaves that had been spectroscopically determined were taken back to the laboratory, dried and crushed, and three replicates of each sample were taken as the average of the chlorophyll and carotenoid values.
The results of the spectrophotometric determination of the pigment content of Cloud Tobacco 87 at different maturity levels and different roasting temperatures were averaged for each key point as shown in Table 1.
Maturity |
Pigment type |
Before baking |
40℃ |
45℃ |
Not yet mature |
Chlorophyll a |
17.640 |
0.602 |
0.251 |
Chlorophyll b |
7.214 |
0.422 |
0.222 |
|
Carotenoids |
3.325 |
0.313 |
0.671 |
|
Mature |
Chlorophyll a |
10.439 |
0.339 |
0.152 |
Chlorophyll b |
4.469 |
0.293 |
0.080 |
|
Carotenoids |
2.162 |
0.866 |
0.550 |
|
Fully mature |
Chlorophyll a |
8.431 |
0.177 |
0.063 |
Chlorophyll b |
3.063 |
0.175 |
0.074 |
|
Carotenoids |
2.031 |
0.528 |
0.467 |
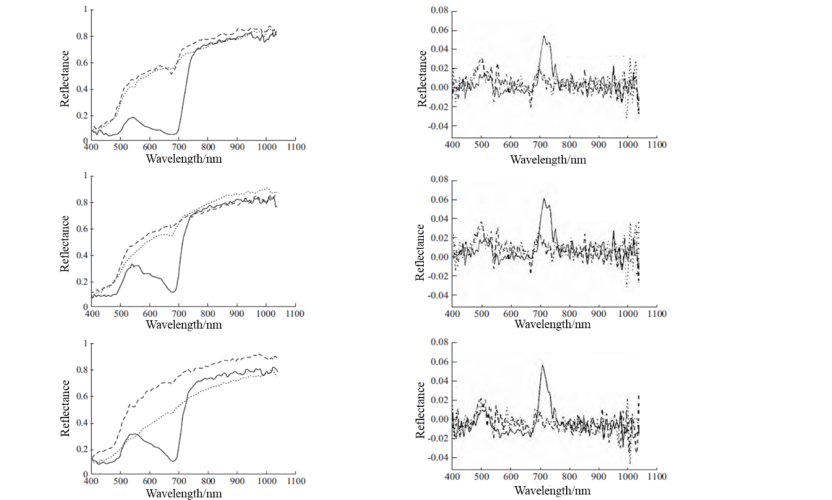
The right-hand side of Figure 1 shows the changes in the spectral reflectance of the leaves of roasted tobacco at still-ripe, mature and fully-ripe levels, respectively, as the roasting temperature increases. The difference in spectral reflectance of the tobacco leaves at each maturity level is evident as the temperature increases during the roasting process. The first-order derivative spectral curve has multiple peaks in the visible range, with peaks at 490-510 nm, 560-570 nm, 580-720 nm, etc., and large jumps in the 400-700 nm and large wavelength ranges, which are determined by the method of calculating the first-order derivative.
Table 2 shows that all three prediction models based on the SPA continuous projection algorithm were effective in predicting chlorophyll concentrations in tobacco leaves at different roasting temperatures, with the SPA-BP prediction model being the most effective, with an R2 of 0.967 and an RMSE of 0.101. The linear models of LR and Ridge are too sensitive to anomalies in the original data, and the Ridge regressions are regularised before modelling and analysis, which results in the loss of some valid data, so the predictive power of the SPA-Ridge model is slightly less accurate than the SPA-BP model. However, the linear regression is not very robust and is heavily influenced by individual data noise, resulting in poor prediction and testing performance of the SPA-LR model. However, the BP neural network approach is better than the linear approach due to its non-linear mapping capability and adaptive learning ability, resulting in better SPA-BP predictions and better prediction accuracy.
Model |
R2 |
RMSE |
MSE |
SPA-BP |
0.967 |
0.101 |
0.014 |
SPA-Ridge |
0.916 |
0.125 |
0.016 |
SPA-LR |
0.956 |
0.129 |
0.017 |
(1) The chlorophyll content of roasted tobacco leaves differed significantly between different maturity levels and between different degrees of roasting treatments. For different maturity levels of roasted tobacco leaves, chlorophyll content at different temperature points during roasting was: not yet mature > mature > fully mature.
(2) The SPA algorithm can be used to filter the hyperspectral data into characteristic bands to achieve data dimensionality reduction and optimisation. Some of the characteristic bands filtered by the SPA algorithm are reasonable and can provide reference for the design of chlorophyll hyperspectral monitoring sensors and inversion mechanism research.