CN

Applications

APPLICATION

Analysis of tea tree classification based on UAV hyperspectral Introduction

Introduction

Since the 1960s, the rapid development of computer technology, spatial analysis technology and so on has accelerated the pace of remote sensing technology. At present, remote sensing technology has been widely applied and developed in various fields such as forestry, geology, military, marine and meteorology. In particular, hyperspectral remote sensing technology, which emerged at the end of the 20th century, has brought new developments to the quantitative research of remote sensing in various fields, and has become one of the important leading technologies in the applied research of remote sensing in forestry. Hyperspectral remote sensing is a technology that combines spectral technology and imaging technology to image target features with ultra-high spectral resolution at the nanometer level, while acquiring tens or even hundreds of bands to form a continuous spectral image. The high spectral resolution of hyperspectral remote sensing, with a typical bandwidth of less than 10nm, has great potential for quantitative monitoring and analysis in forestry.

In forestry remote sensing applications, hyperspectral remote sensing data plays a pivotal role in forest fire monitoring, forest resource change information extraction, forest pest and disease assessment, forest classification and survey, etc., adding a new technical means for real-time and scientific forest management. At present, forestry hyperspectral technology is in the development stage and has been able to provide a variety of ground-based hyperspectral remote sensing data. The effective integration of forestry resource management and forestry survey and monitoring is a facsimile requirement of forestry remote sensing. This requires improving the accuracy of forest fire monitoring, forest resource change information extraction, forest pest and disease assessment, forest classification and survey, etc. The birth of hyperspectral technology provides a powerful means to improve the accuracy of forest monitoring.

Ⅰ.Study area

Wuyi Mountain, Fujian, geographical coordinates: 117°27′-117°51′ East, 27°33′-27°54′ North.

II. Hyperspectral data acquisition equipment

2.1 Introduction to hyperspectral data equipment

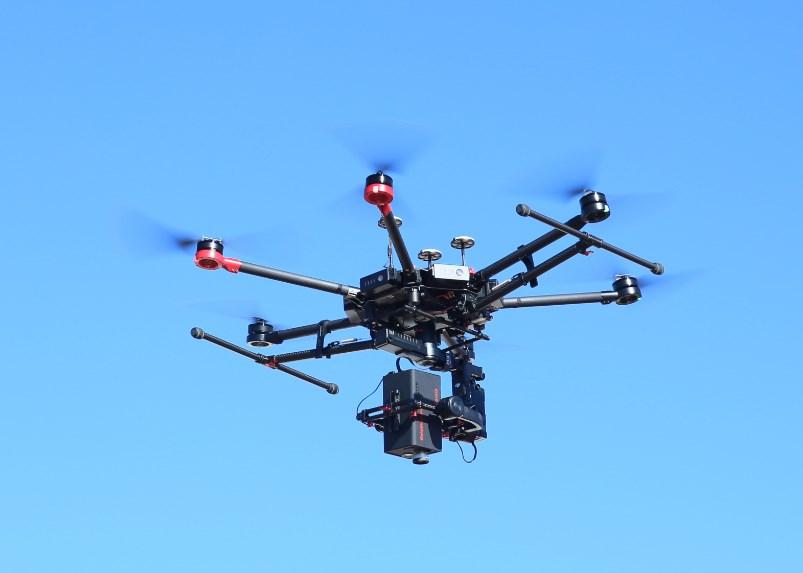
The GaiaSky-mini2 hyperspectral imaging system is a high-performance airborne hyperspectral imaging system developed for small rotary-wing UAVs. It adopts the built-in scanning system and stabilization system with independent domestic and foreign corresponding technology patents, and successfully overcomes the problems of poor imaging quality caused by the vibration of the UAV system when the small UAV system is equipped with a push-and-scan hyperspectral camera.

At the same time, the system takes into account the rotor and fixed-wing UAS flight mode of push-scan imaging and realizes the application requirements of a large area and a long flight time through the high-precision POS system and the built-in acquisition and storage unit. The hyperspectral data collected by the system can be stitched together, calibrated and the test results inverted by self-designed software. Figure 1 shows the unmanned airborne hyperspectral imaging system and Figure 2 shows the Gaiasky-mini2-VN device.

Figure 1 Unmanned airborne hyperspectral imaging system

Table 1 GaiaSky-mini2 airborne imaging hyperspectral system parameters2.2 Introduction to hyperspectral equipment parameters

No

Projects

Parameters

1

Spectral scan range/nm

400~1000

2

Spectral resolution/nm

3.5 nm

3

Imaging lens/mm

18.5

4

Number of spectral channels

360

5

Full frame pixels

1936×1456

6

Sensor

CCD Sony ICX 674

Ⅲ.Inversion result display

3.1 First flight


Figure 2
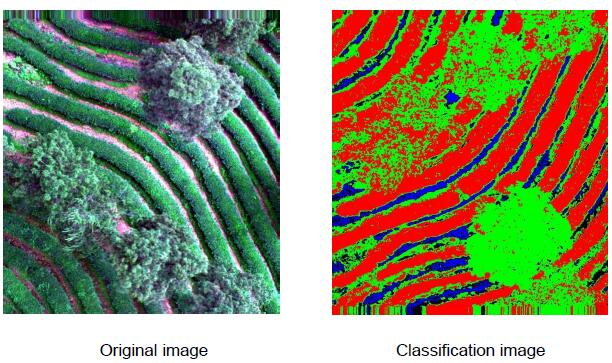
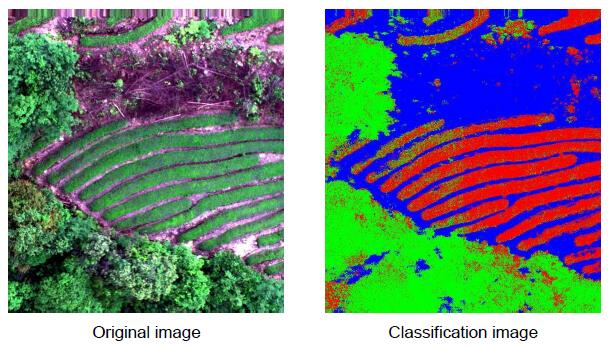
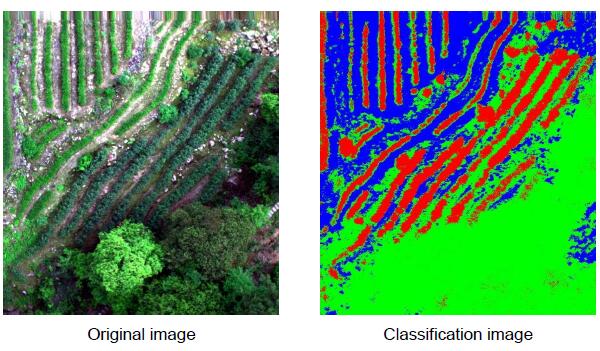
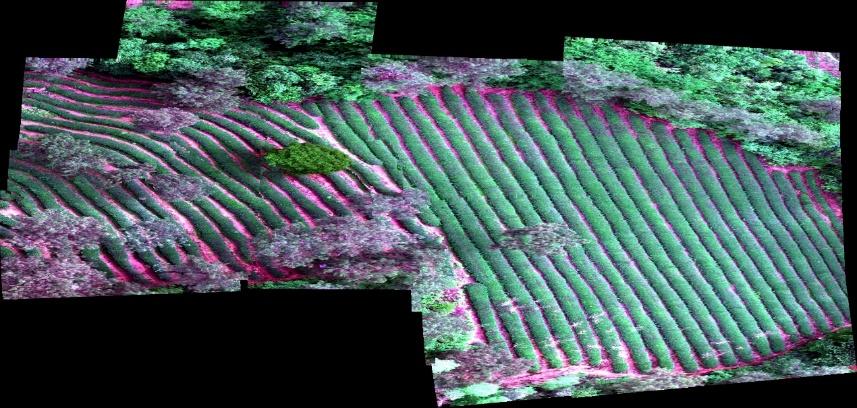
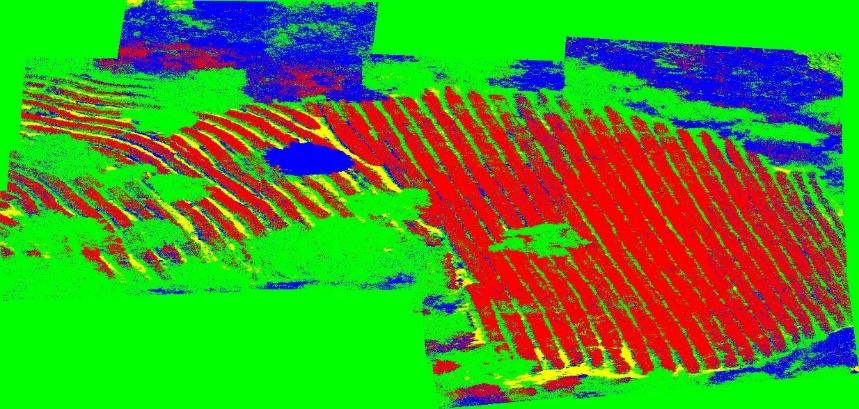
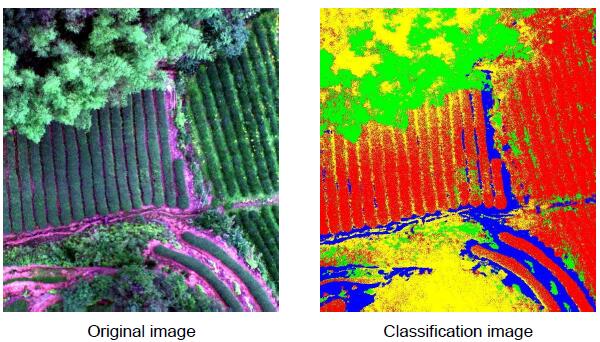
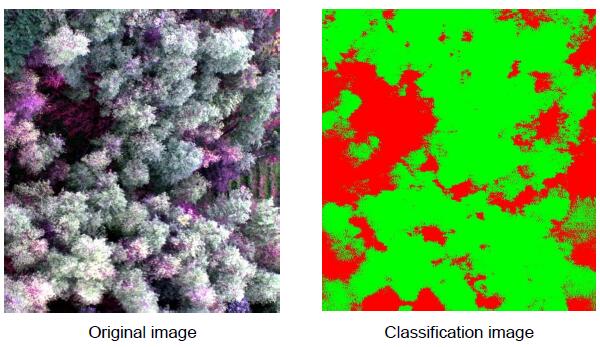
Three images from the first frame of the flight were selected, and the whole image after the first frame was stitched together for the classification of tea trees and other tree species identification, and the results are shown in Figures 2 to 4. As can be seen from the figures, the red striped areas are all tea trees, which is a good classification effect and allows an accurate view of the specific location of tea tree distribution.


Figure 3

Figure 4


Original image

Figure 5
 

3.2 Second flight

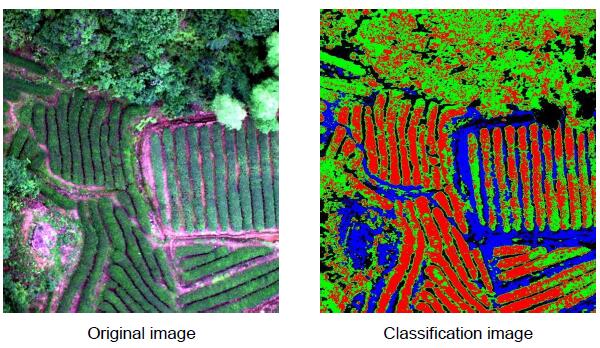
Four images from the second flight were selected for the classification of tea trees and other tree species, and the results are shown in Figures 6 to 9. It can be seen from Figures 6 to 8 that the red striped areas are all tea trees, and the classification effect is good; however, the classification effect in Figure 9 is not good, and the reason for this can be seen by analyzing the spectral curves of tea trees and other tree species in Figure 10 (green is the spectral curve of tea trees, red is the spectral curve of other tree species). The reason for this is perhaps that the sun was not at its best at midday when the flight was taken, but around 4 or 5 pm, when the tea trees were shaded by other trees and some of the shaded parts were not even visible. The probability of misidentification is therefore increased.


Figure 6

Figure 7
Figure 8

Figure 9


Figure 10
 

Ⅳ.Conclusions

UAV hyperspectral can better identify the distribution location of tea trees. The hyperspectral data of tea obtained under good flight conditions is more conducive to analysis and research, and can further improve the accuracy of classification and identification.