APPLICATION
Introduction
The air contains more than 10% free silica dust, commonly known as silica dust. Long term exposure to silica dust will lead to silicosis, which is the most serious occupational disease in China. At present, there are three methods to determine the content of free silica in the air in China: pyrophosphoric acid method( gravimetric method), infrared spectrophotometry method and X-ray diffraction method. Pyrophosphoric acid method is the preferred method currently used. However, there are some problems in this method, such as tedious operation, long time and difficult to control the error. Infrared spectrophotometry can only be used to measure the content of crystalline silicon dioxide by measuring its absorbance, and it is rarely used in the base because of the expensive instrument and high operation requirements.
Raman spectrum is the fingerprint spectrum of molecular vibration. Different material molecules have different vibration frequency, so it is often used as an important basis for material identification. It has the advantages of simple operation, high sensitivity and good repeatability. The commercialization of portable Raman spectroscopy technology also greatly reduces the work cost, which makes it possible to be used as a rapid detection and analysis method for dust qualitative and quantitative in the production line. In this paper, through the Raman spectrometer quantitative analysis of silica dust samples, through the experiment to prove the feasibility of its application in the field of analysis of dust.
Experiment
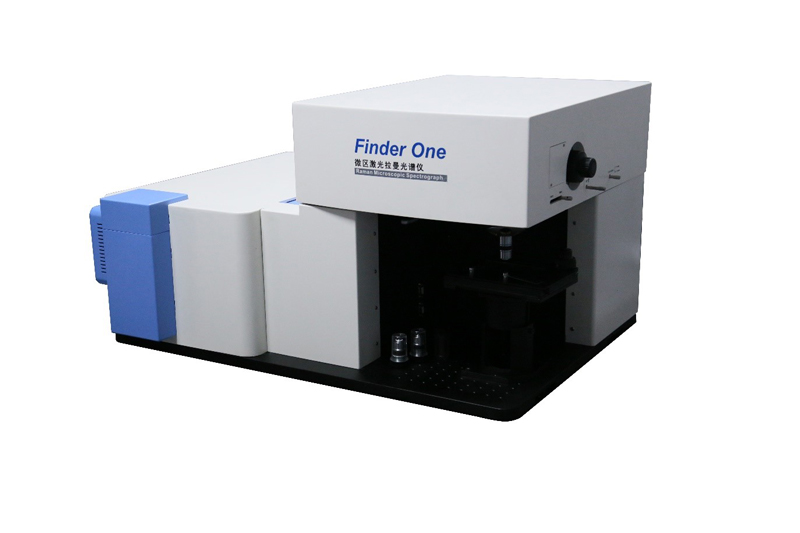
Experiment equipment: ”Finder One” micro laser Raman spectrometer( Zolix Instrument Co. Ltd);Laser wavelength 532nm, Laser power 10mW, the grating is 600g/mm and the resolution is 2cm-1;the signal is collected by 100 times microscope objective, the integration time is 5s, and the cumulative times are 3 times. The instrument is shown in Fig.1
Sample: According to the different mass ratio of silica power and corundum, the silica powder content of A1-A5 is 20%, 40%, 60%, 80%, 99%, and one corundum sample is taken as the control sample.
Analysis of result
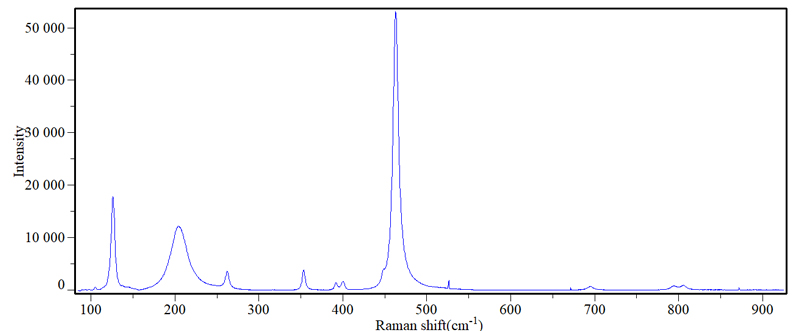
The Raman peaks of silica powder samples are 129,209,265,393,456 cm-1. There are two weak narrow bands in 600-800cm-1, belonging to Si-O-Si symmetric stretching vibration, and 100-600cm-1 is Si-O bending vibration.
More than 99% of A5 sample is silica, and its Raman spectrum is shown in Fig. 2
Fig.2 The Raman spectrum of A5 sample
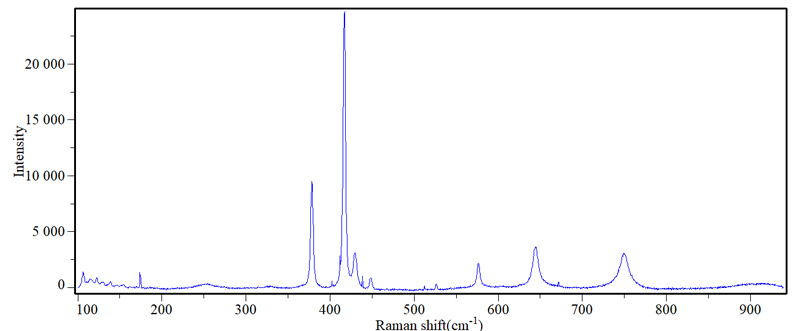
The Raman spectra of corundum samples are shown in Fig. 3
Fig.3 The Raman spectra of corundum samples
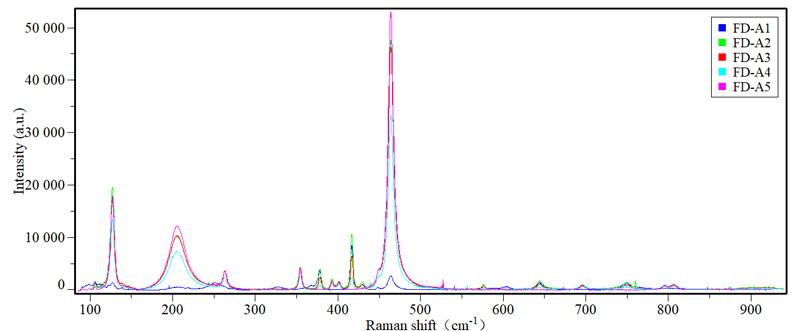
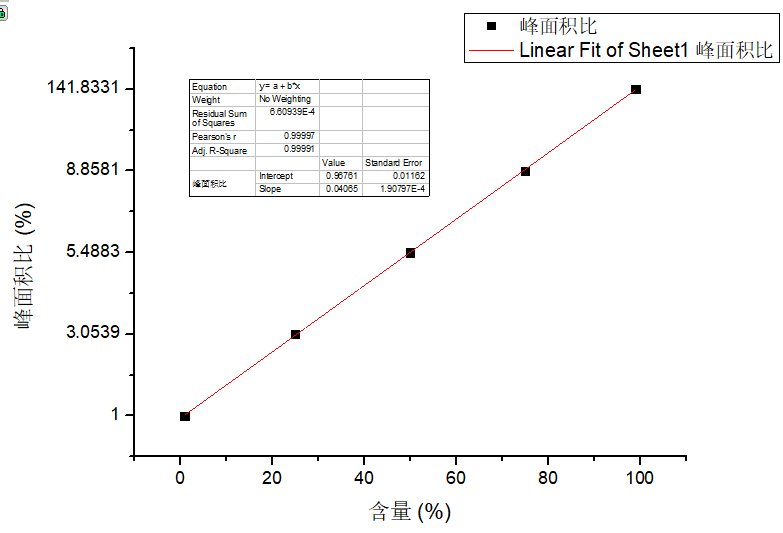
It is found that the content of silica sample can be quantitatively analyzed by peak area ratio method through silica characteristic peak (465cm-1) and Raman characteristic peak (415cm-1) of corundum sample. The Raman spectrum of A1-A5 sample is shown in Fig. 4
Fig.4 The sample A5-comparison of Raman spectra of blank samples
The peak area ratio A415/A465 fitting curve is shown in Fig.5
Fig.5 The peak area ratio A415/A465 fitting curve
It can be found from the figure that the peak area ratio increases linearly with the increase of silica content. Therefore, the silica content in dust can be accurately and efficiently obtained by establishing the standard curve.
Conclusion
The content of free silica exceeded may harm the exposed personnel. Raman spectroscopy technology can quantitatively analyze the content of silica. The commercialization of portable Raman spectroscopy technology also greatly reduces the cost, which makes it possible to be used as a rapid detection and analysis method for dust qualitative and quantitative in the production line. It is of great significance to monitor the free silica content in dust in real-time and on-site monitoring by Raman spectroscopy technology.